The challenge
Engine usage generates valuable data for users, but the raw numbers don't always tell the full story.
The challenge was to make engine usage data easier to understand and more useful in an operational context. Our users needed a way to explore how their engines are operating over time, using engine speed and torque to get a clearer picture of their operating patterns.
Part of the challenge was finding the right level of detail. The data could provide useful insights for an individual engine, but wasn't necessarily representative of the entire fleet.
My role
I acted as the feature owner and product designer, taking over the feature from the analytics team to deliver a complete design and experience to the developers.
My responsibilities included:
- Defining the feature scope and identifying the key user needs.
- Aligning stakeholders around the purpose and direction of the feature.
- Exploring information hierarchy and data visualisation approaches.
- Designing the experience, including different data states.
- Working closely with developers to clarify details and support implementation.
Three key design decisions
-
Put the data in the right context
Initially, one of the most important questions was where engine usage information should live.
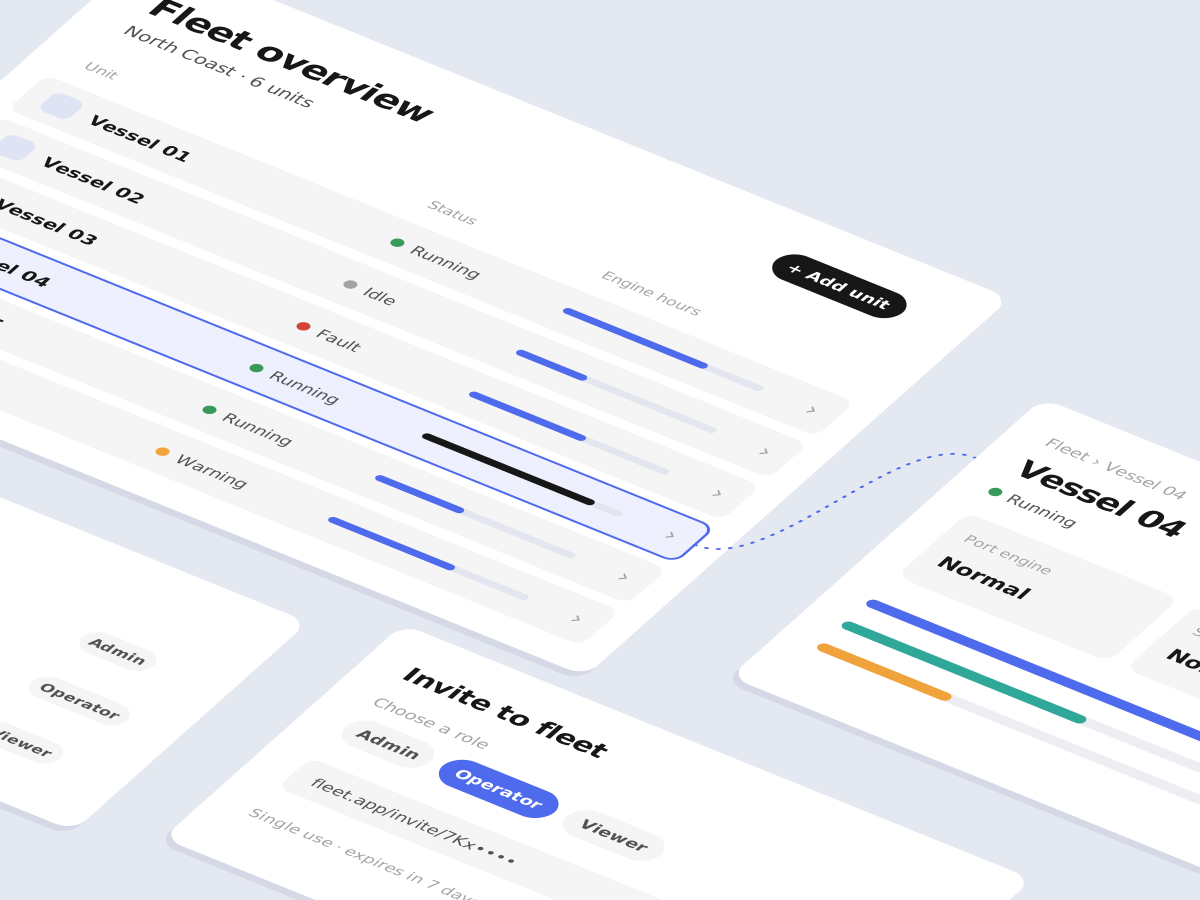
While a fleet-level overview might seem like a natural place for operational data, engine usage is highly specific to individual units. Presenting it at fleet level could give users a misleading picture of their engine health.
I instead placed the feature within the individual unit's dashboard. This gave the information a more relevant context and connected it to the engine and unit it actually described.
-
Turn raw data into something users can interpret
Simply displaying the engine values wouldn't be enough. Users needed to understand how speed and torque related to each other and how they changed over time.
I therefore moved towards a graph-based data visualisation instead of a static representation. This allows users to get a better understanding of the relationship between the two measurements and to recognise patterns in the engine's performance.
The goal was to make the data easier to interpret without losing the technical depth that makes it valuable.
-
Account for gaps in the data
A visualisation is only useful when there's sufficient data to support it.
Engine data isn't always available in the same quantity or at the same level of detail, so I considered how the experience should change when there isn't enough information to display a graph.
Rather than presenting a misleading visualisation, the design communicates that the data is insufficient. This helped set expectations and made the feature more robust across multiple scenarios.
Outcome
The result was a more focused way of presenting engine usage information. By placing the feature at unit level, using graphs to communicate engine load, idle time and more, and designing for empty-data states, the new design gave users a clearer way to understand their engine usage data.
What I learned
This project reinforced the old UX notion that making data visible isn't the same as making it understandable.
I also learned the importance of challenging where a feature belongs before focusing on how it should look. Getting that decision right can have a significant impact on the final experience.