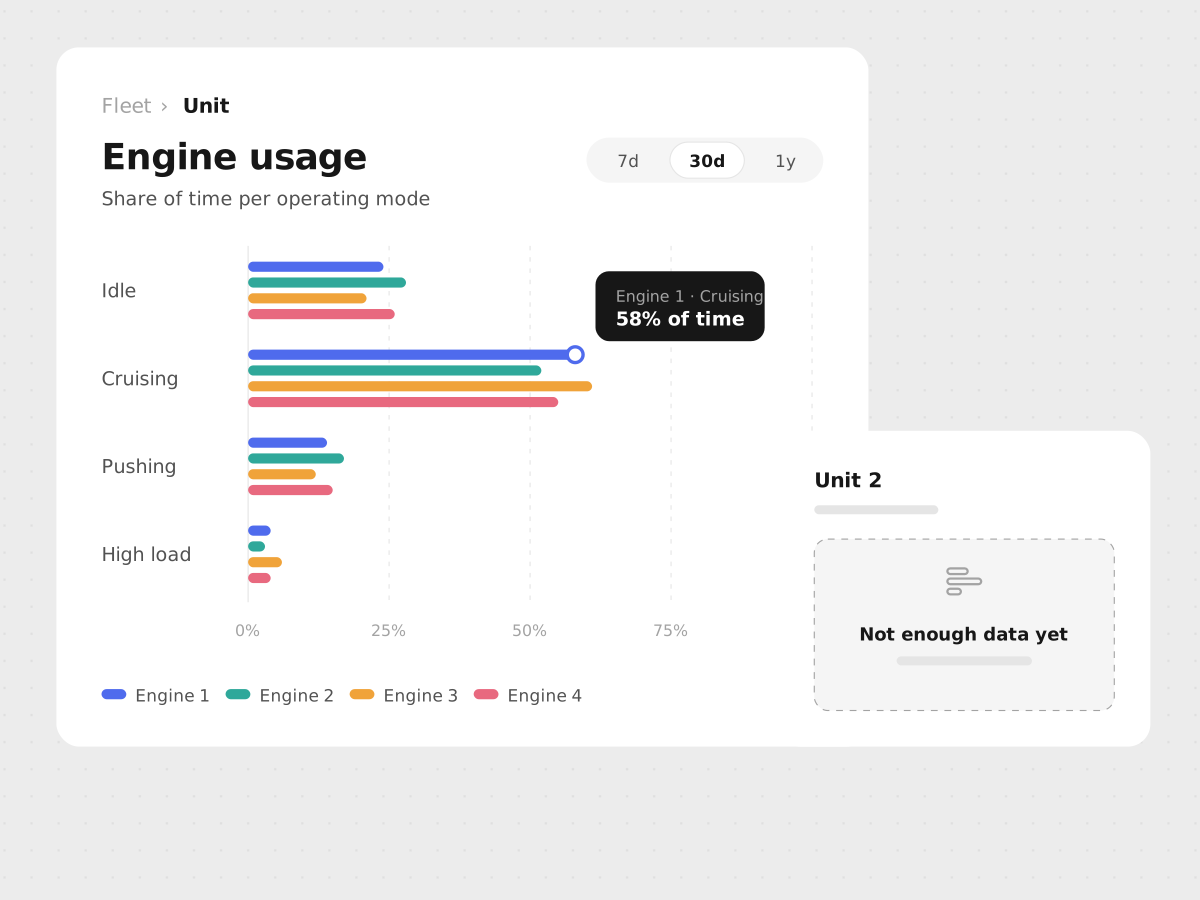
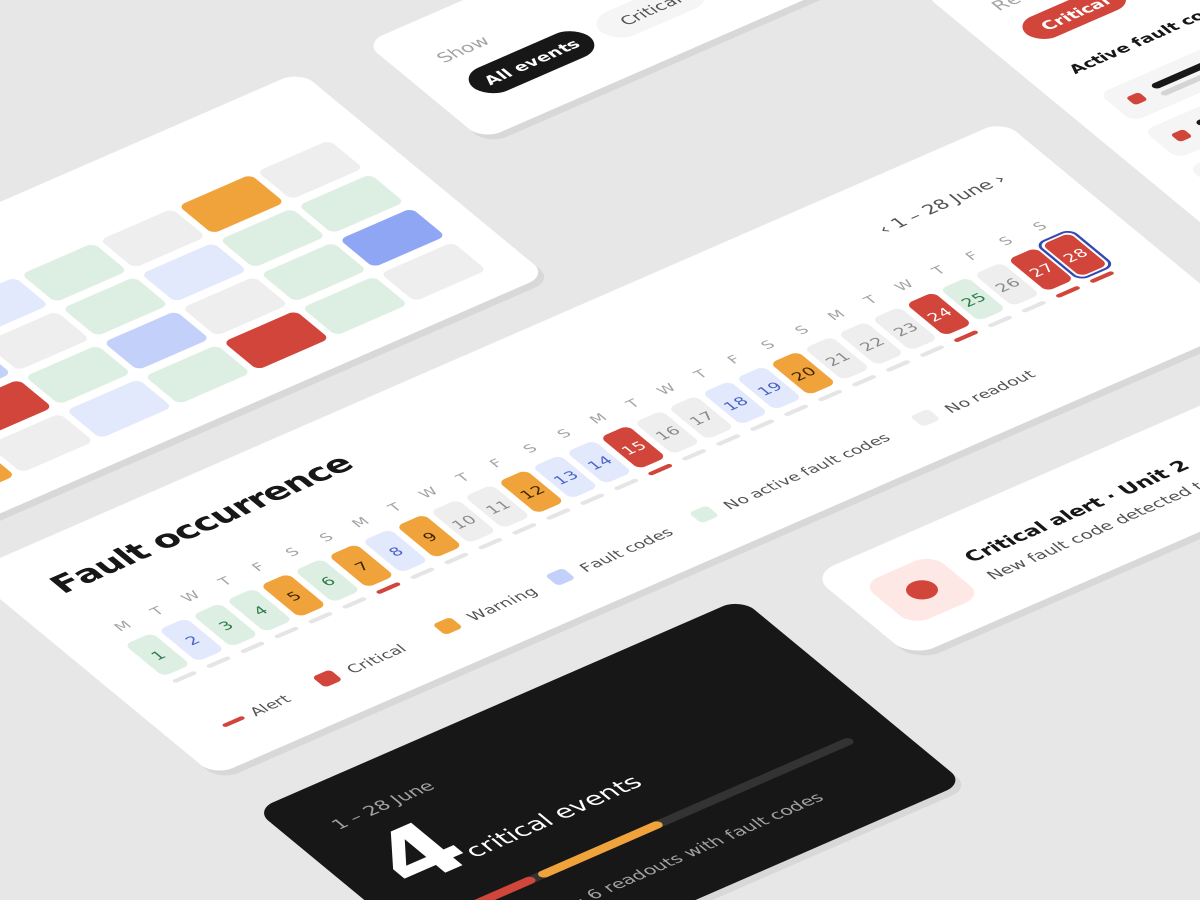
The challenge
Usage data for Volvo Penta Connect lived in two tools. Adobe Customer Journey Analytics showed what people did; Hotjar showed what they wrote. Nobody saw the two together, and the numbers often contradicted each other.
In October, the Connect Dashboard showed 402 sessions while Unit Registration showed 642: more people registering units than using Connect at all. Key questions had no answer, such as how many users are Marine or Industrial, and where people give up when registering a unit.
Written feedback was sorted so loosely that one answer could count under several themes, and "Something isn't working" said nothing about what was broken.
My role
I was the product owner and designer. I decided which questions the page should answer and what it would take for people to trust it, and I brought the domain knowledge the data couldn't, such as which accounts are internal.
I directed an AI coding agent (GitHub Copilot CLI), which wrote the code and queried the data, and I checked every number against Adobe and Hotjar before it went on the page.
Three key design choices
-
Questions, not tools
The page is organised around what the team asks: what users are looking for, who they are, how registrations are going and what they say. Each section draws on both sources, so behaviour and feedback can be read together.
Suggested actions at the top turn findings into a to-do list, and any action becomes an Azure DevOps Feature in one click.
-
Every number explains itself
The mismatches turned out to be hidden filters. Two forgotten segments removed about 90% of Connect sessions (402 became 4,994), and an outdated "external users" segment still counted 196 Volvo employees.
So the page makes these choices visible: excluded accounts are named in the report, segments can be switched off without touching the shared Adobe project, the comparison period is always stated, and estimates are labelled as estimates.
-
Where people get stuck, not just totals
A Sankey diagram shows where registrations drop off, split by Marine and Industrial.
Feedback now gets one theme per answer, and "isn't working" is split by cause: adding a unit, logging in, finding things, or pages not loading.
Working with AI
I worked in short loops: a concrete request, often with a screenshot, then a look at the result with real data.
The agent excelled at detective work, rebuilding Adobe numbers step by step to find the segment that broke them, which would have taken me days. Its first answer wasn't always its best, so I learned to ask "how sure are you?".
The decisions stayed mine, for example keeping changes inside the app instead of editing a shared Adobe project that other teams rely on.
Outcome
The team has one place for its analytics questions, shareable as a PDF and connected to Azure DevOps. The conflicting numbers are explained and fixed.
We also learned new things: roughly three in four visitors are Marine, Industrial users often abandon registration, one in four users returns within a month, and the most common complaint is a serial number that can't be found.
The tool now serves as a foundation for key feature decisions and improvements to the product.
What I learned
Data design is design: what you count and how you label it shapes decisions as much as layout does. Trust comes from transparency, not precision.
And with AI, the human value is judgement and domain knowledge. The AI found the broken segment, but only I knew what the numbers meant for our users.